Seven numbers: cash, net burn, runway, MRR, customer concentration, team cost and the effect of the hire you are considering. Anything beyond those is decoration until you have a finance team. Below is each one as Plainhub shows it, taken from the app's sample workspace (fictional data).
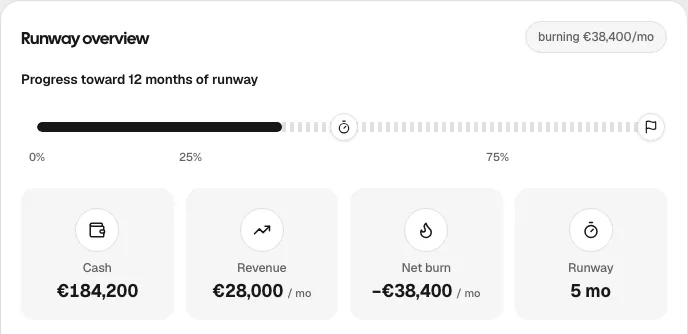
Runway overview in the sample workspace: cash, revenue, net burn and runway on one card.
The seven numbers a startup financial dashboard has to show
A startup financial dashboard has to show seven numbers: cash, net burn, runway, MRR, customer concentration, team cost and the effect of a planned hire or cut. Each is below with its formula and a screenshot from Plainhub's sample workspace, which uses fictional data, so you can see what the number looks like and how it is worked out.
1. Cash
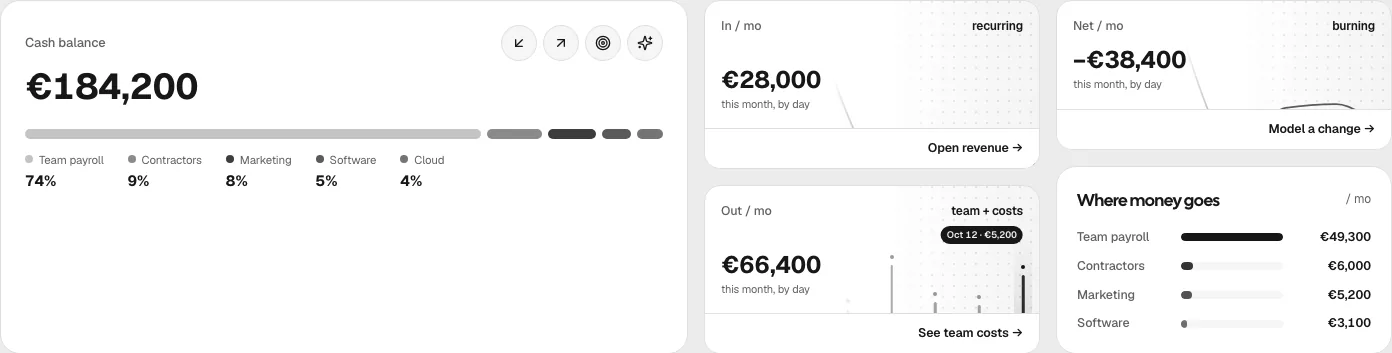
What is in the bank today. It is the starting point of every other number, so it should be the biggest figure on the page and the one you update first. Next to it, show where the monthly outflow goes, because a cash balance alone says nothing about how fast it is leaving.
Money page, sample workspace: cash balance, money in and out per month, and where the spend goes.
2. Net burn
Monthly costs minus monthly recurring revenue. It is the number most founders quote loosely, so write the formula down once and let the dashboard hold you to it.
net burn = monthly costs - MRR
sample workspace: €66,400 - €28,000 = €38,400 a month
Gross burn (costs alone) is a useful second line, but net burn is the one that drains cash. The burn rate guide covers the edge cases, such as one-off costs.
3. Runway
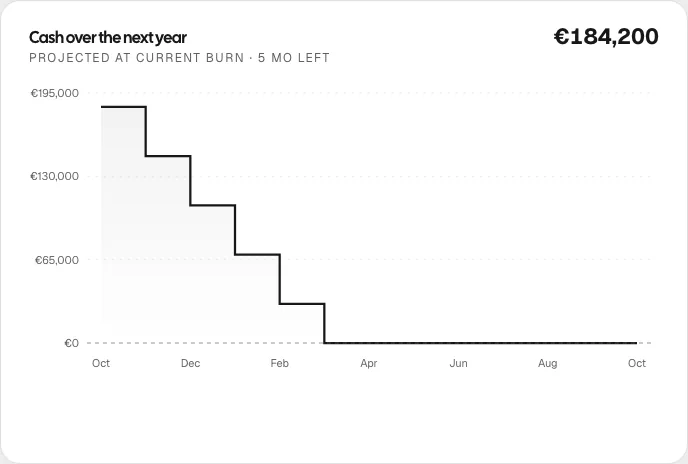
Cash divided by net burn, in months, with a date next to it. A month count feels abstract; a date in February does not. Show it as a line you can see running down, not only as a figure.
Cash over the next year in the sample workspace: a straight-line projection at today's burn, 5 months left.
That line is a projection from today's numbers, not a forecast of what will happen. It tells you how long the current plan lasts. For a quick check without an account, the free cash runway calculator does the same division.
In CB Insights' analysis of startup failures among VC-backed companies that shut down since 2023, running out of capital was the most cited reason, at 70%, though CB Insights calls it almost always the final cause rather than the root problem.
4. MRR and how it is moving
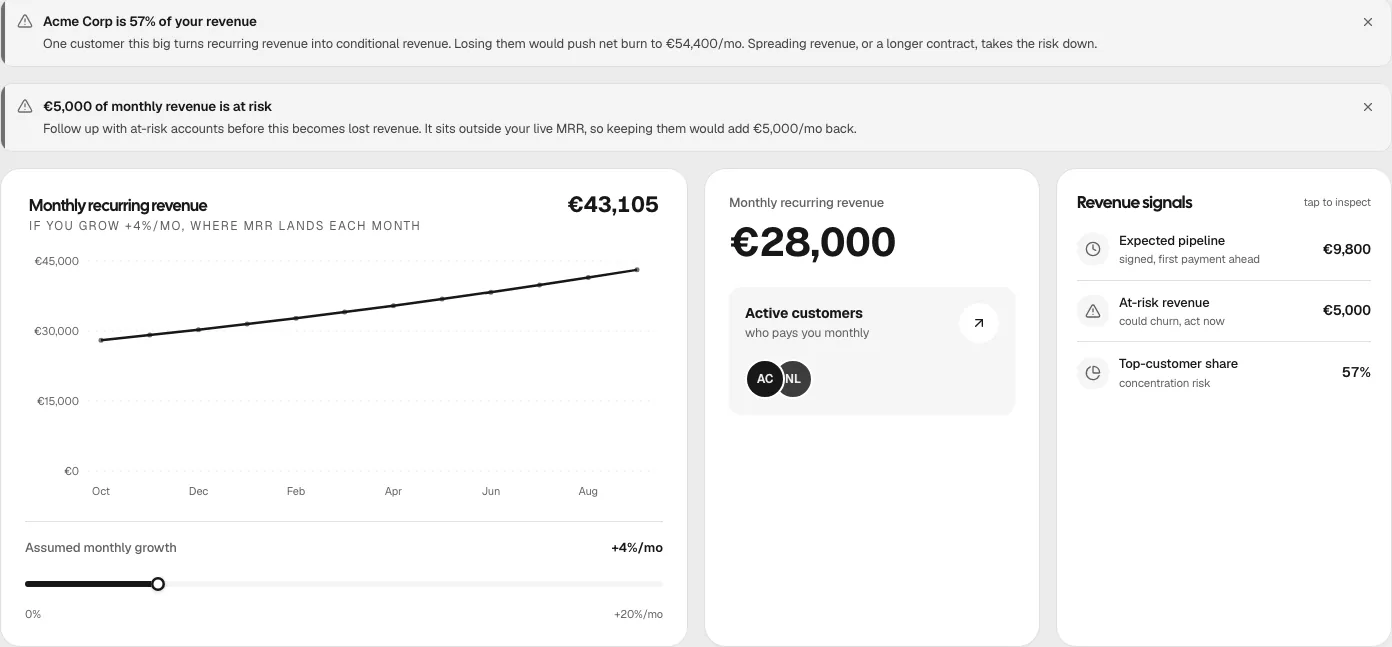
Monthly recurring revenue is the share of revenue that repeats, so it excludes one-off fees and customers who have signed but not yet paid. A useful dashboard also shows what is about to enter MRR and what could leave it. In the sample workspace, €28,000 is live, €9,800 is signed but not paying yet, and €5,000 is flagged at risk. What is MRR explains the definition.
Revenue page, sample workspace: MRR, expected pipeline, at-risk revenue and the concentration warning. The chart is a projection at an assumed 4% monthly growth that you can change.
5. Revenue concentration
The share of MRR that comes from your largest customer. It matters because losing one account changes burn at once: here Acme Corp is 57% of revenue, and losing it would lift net burn from €38,400 to €54,400 a month. Plainhub flags any customer at 30% or more. The one customer too big post goes through what to do about it.
concentration = largest customer MRR / total MRR
sample workspace: €16,000 / €28,000 = 57%
6. Team cost and its share of spend
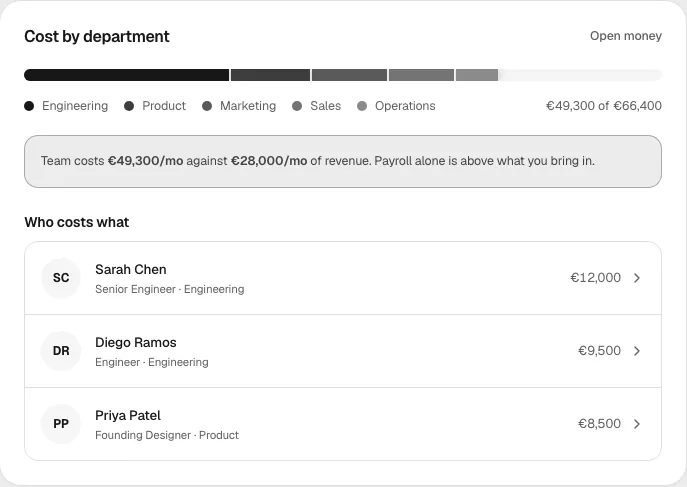
For most startups payroll is the biggest line by far, so the dashboard should break it down by department and say how much of total spend it is. In the sample workspace, team cost is €49,300 a month, 74% of spend, and above the €28,000 of revenue.
People page, sample workspace: cost by department and what each person costs.
7. The effect of a planned hire or cut
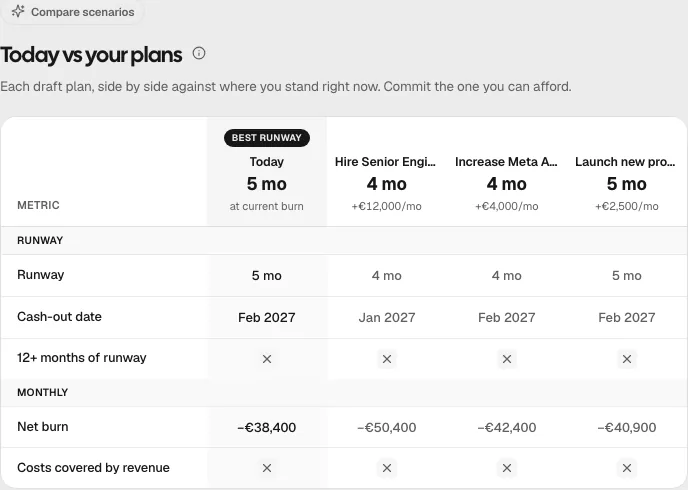
A dashboard that only describes the past answers half the question. The other half is what a decision does to runway before you make it. Plainhub keeps a plan as a draft, which changes nothing in your live numbers, and shows runway with and without it. Commit the plan and it becomes part of your costs from its start date.
Plans page, sample workspace: today next to each draft plan. The €12,000 a month hire moves runway from 5 months to 4.
Ask the dashboard a question
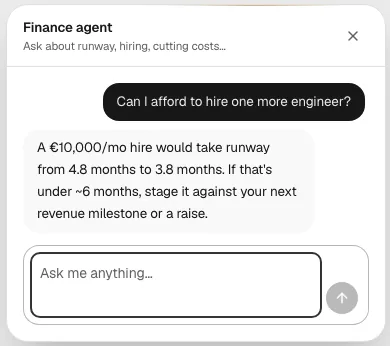
The finance agent answers from the numbers on the page. In the demo, answers come from built-in rules on the sample data, so a question about hiring gives a plain calculation, not an opinion. With a paid plan the agent is a language model grounded in your recorded numbers, limited to 20 questions an hour; see the AI CFO page for what it can and cannot answer.
Finance agent in the sample workspace (demo answer): a €10,000 a month hire takes runway from 4.8 to 3.8 months.
What a CFO dashboard adds at later stages
A CFO dashboard is the same core seven numbers plus the things a finance team can maintain. The seven carry a company a long way, usually through the seed stage; the additions below matter once someone owns finance and the books are clean enough to feed them.
A 13-week cash view, because once payroll and supplier dates matter, a monthly average hides the week the balance dips.
Budget against actual by department, so a team lead owns a number.
Accrual figures: revenue recognised, deferred revenue, gross margin on a real P&L.
Cohort retention and net revenue retention once there are enough customers to read them.
Investor and board reporting that ties back to the books.
Most of that needs data from accounting software and someone to keep it clean. If the books are not ready, a dashboard built on them shows confident numbers that are wrong. Start with the seven, and add the rest when a person owns the data behind them.
A CEO dashboard for a small company
If you run a company of 5 to 50 people, a CEO dashboard is the one page you open every Monday to see whether the business is on track. It has two layers. The money layer is the seven numbers above. A CFO dashboard is the same layer with more finance detail, so at this size the CEO and CFO views are mostly one page.
The non-money layer is what you track in other places:
Pipeline: qualified opportunities, deals expected to close this quarter and how long they take to close.
Delivery: projects late, clients waiting on you, and the capacity left in the team.
Hiring: open roles, offers out and the start dates that will change team cost.
Plainhub covers the money layer only. It has no pipeline stages, project tracking or hiring tracker. The one overlap is hiring: a planned hire becomes a draft plan that shows runway before and after. Keep pipeline in a CRM and delivery in your project tool, and read the weekly review with the money layer next to them. For the client side of the money layer, see the client tracker page.
What should a CEO dashboard show?
Cash, runway and net burn first, then MRR with what is about to enter it and what could leave it, then the share of revenue from your largest customer. Add pipeline, delivery and hiring from your own tools. Five to eight numbers a week is enough; more than that and nobody reads it.
Is a CFO dashboard different from a CEO dashboard?
At a small company it barely is. A CFO dashboard adds the things a finance team maintains, such as budget against actual, accrual figures and a 13-week cash view. Until someone owns that data, the seven numbers above serve as both.
What Plainhub's dashboard does not do
Plainhub's dashboard covers the money layer from numbers you record, and it stops there: it does not connect to a bank or accounting software, produce an accrual P&L or balance sheet, offer a 13-week view, or split MRR into new, expansion and churned revenue. The full list follows.
It does not connect to your bank or accounting software. It knows only what you record.
It does not produce an accrual P&L or a balance sheet.
It has no 13-week cash view. The projection is a straight line from this month.
It does not show MRR split into new, expansion and churned revenue, only live MRR, expected pipeline and at-risk revenue.
It is not accounting software and does not replace an accountant.
Pro is €29.99 a month and Max is €59.99 a month. There is no free trial. The live demo on the homepage runs the same app on the sample workspace with no signup, so you can click through every page shown above before paying.
See your own seven numbers
Enter your cash, costs and customers and the dashboard builds itself in about a minute. Try the demo first if you want to look around.